What is Data Analytics? A Complete Guide in 2025
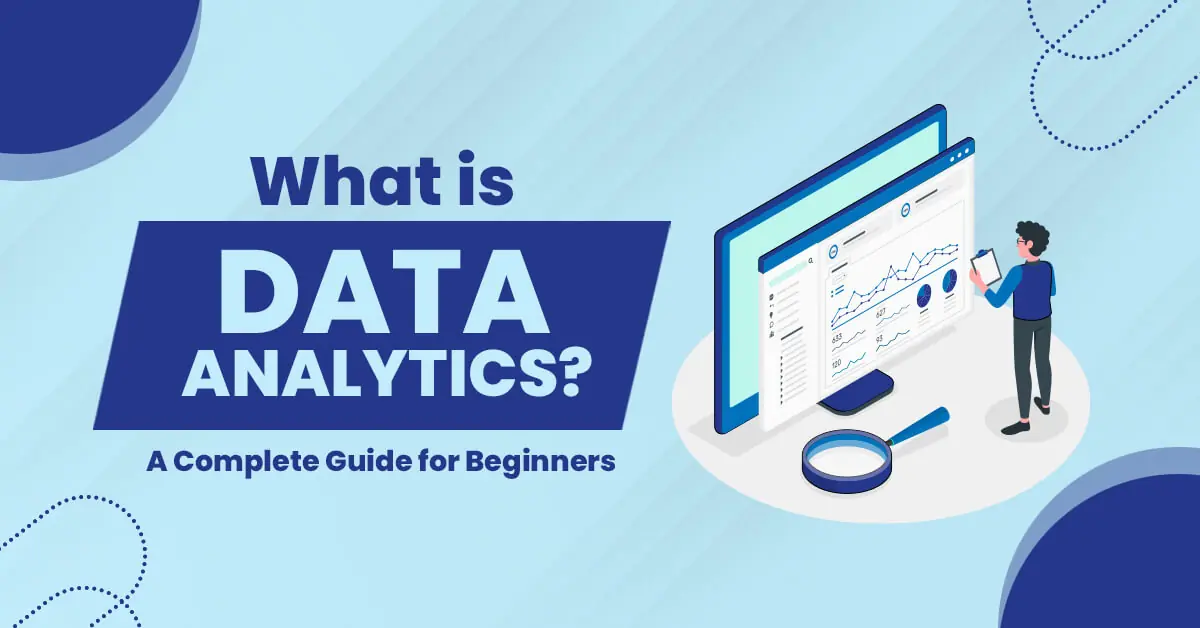
Data analytics is a crucial aspect of business today. It has the ability to analyze data and make conclusions based on that data has become an essential part of the modern business landscape. Companies effectively use data analytics as part of their daily operations.
While many companies are aware of the importance of data analytics, not all companies fully understand what exactly it means to analyze data. A company’s data can come from any number of sources: social media posts, website traffic logs, sales records, or even internal surveys conducted within the company itself.
This blog will enlighten you with some basic data analytics concepts, definitions, and lots more.
What is Data Analytics?
Data analytics is a process of collecting, cleansing, transforming, and preparing data for analysis. Its output helps analyze through different statistical methods. Thereafter, it provides useful insights into the data. It helps in decision-making. It is an important part of business intelligence (BI) that helps companies improve their operations and make better business decisions.
Data Analytics helps find useful insights and convert them into actionable strategies. It aims to improve the efficiency of business operations, maximize profitability, and achieve a competitive advantage over competitors. In this article, we will discuss what is data analytics, its types, why it is important, and more.
Data Analytics is an indispensable tool for businesses. It offers strategic advantages over its competitors by providing deeper insights into customer behavior. Data analytics offers better service quality than other traditional methods like surveys and interviews. It requires significant time investment from both sides (e-commerce businesses).
Types of Data Analytics
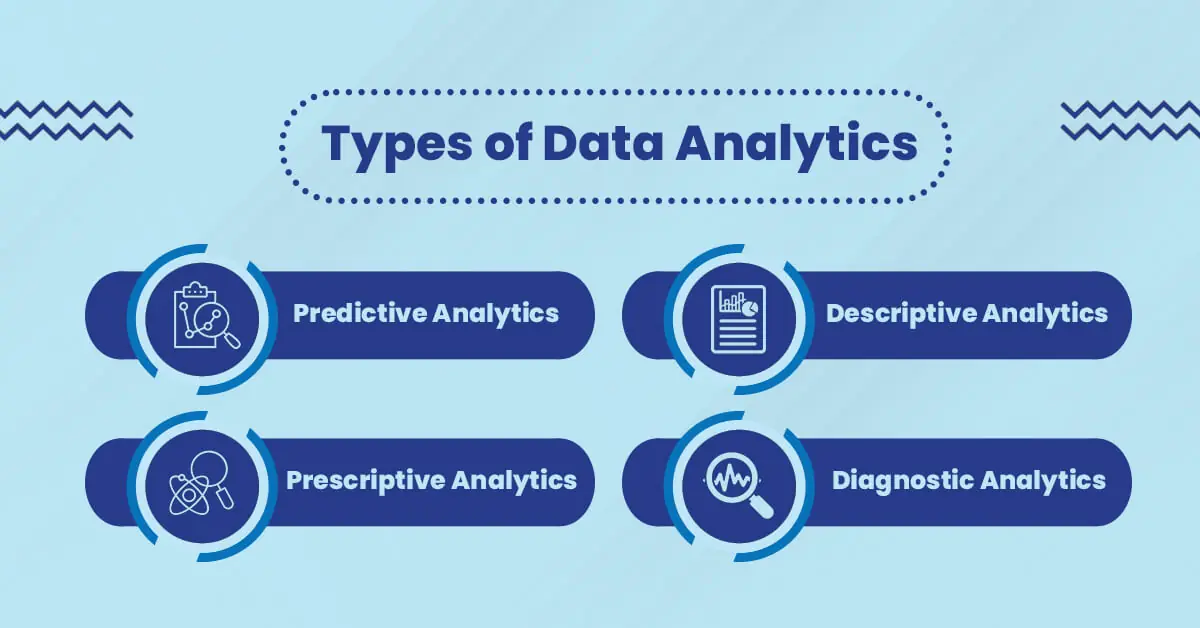
Data analytics is the process of using statistical, mathematical, and computer science concepts to extract insights from data. Data science is a subset of data analytics that focuses on extracting useful information from large volumes of data. It’s important to note the difference between the two. The four types of data analytics are,
1. Predictive Analytics
Predictive Analytics uses historical patterns to make predictions about future outcomes. It helps sales forecast and does customer segmentation. It aims for fraud detection and cyber security like detecting suspicious activity within an organization.
2. Prescriptive Analytics
Prescriptive analytics combines predictive with prescriptive models (or rules-based systems) that provide recommendations based on historical trends. It includes real-time inputs into different steps with different stakeholders within an organization. Prescriptive analysts need guidance in making decisions based on certain criteria.
3. Descriptive Analytics
This helps make observations or collect data through experiments. Its purpose is to describe what happened during those experiments. Thus there’s no confusion about whether any patterns exist between variables over time.
4. Diagnostic Analytics
The diagnostic analysis uses historical trends and current information about a situation before providing feedback about possible causes. For example when productivity drops suddenly due maybe because someone left early without giving notice before leaving work early without notice etc.

What is the Role of Data Analytics?
Data analytics is for analyzing data to find useful insights and convert them into actionable strategies. It aims to improve the efficiency of business operations, maximize profitability, and achieve a competitive advantage over competitors.
It is one of the hottest career fields in today’s world. Many companies are looking for data scientists who can help them make sense of their large amounts of unstructured data.
Why Data Analytics is Important?
In today’s world, data analytics is inevitable to make improved business decisions. Making better decisions helps you take your business to grow fast. Let us look at the ways in which data analytics can help you.
1. Better Decision Making
By collecting, analyzing, and making sense of data from different sources, businesses are able to make better decisions about their operations and product lines.
2. More Informed Decisions
Data analytics provides companies with a deep understanding of their customer’s behaviors. Then they can customize their products or services. This leads to happier customers who stay loyal to the brand!
3. Faster Business Growth
Data analytics helps understand users’ behavior on various digital platforms like Facebook, LinkedIn, etc.
This helps them improve user experience by changing things such as website design & layout, etc. It will lead directly toward increased sales volumes resulting in faster growth for any firm!
Top Data Analytics Techniques
Data analytics is a powerful tool that can help businesses make smarter, more informed decisions. It includes everything from marketing to engineering and even finance. Here are the top data analytics methods to choose from.
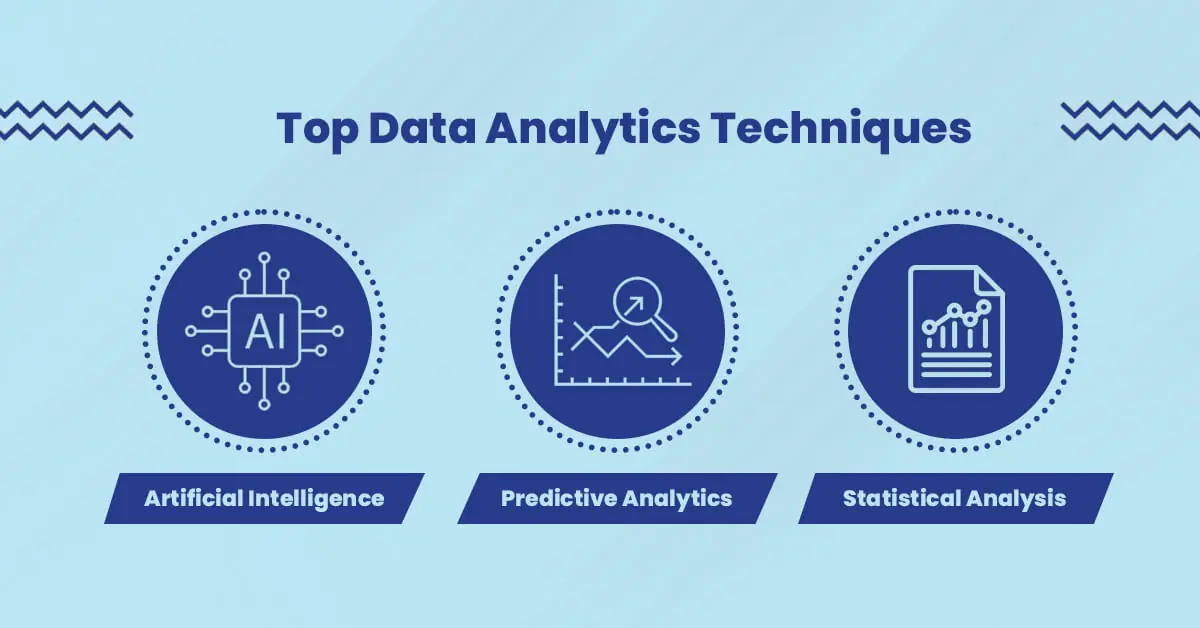
1. Artificial Intelligence (AI)
Artificial intelligence is a branch of computer science that focuses on how to make computers behave like humans. AI in data analytics helps interpret large volumes of data. It makes predictions based on what the data tells us. AI helps understand what consumers want. AI also helps understand more complex tasks like tracking inventory or predicting customer behavior.
2. Predictive Analytics
Predictive analytics is another branch of computer science. It focuses on predicting future events based on historical patterns or trends in data sets collected from past events. It uses data to predict future outcomes. So that companies can prepare for them beforehand and prevent them from happening altogether if possible.
3. Statistical Analysis
Statistical analysis is one of the common data analytics techniques for business. This type of analysis uses mathematical formulas to analyze. It helps predict future events based on past trends. It can also help you determine whether your current strategy is working or not.
Having access to large amounts of data offers opportunities for businesses that weren’t previously possible. For instance, targeted marketing campaigns based on customer demographics or personalized product recommendations based on past purchases.
However, these opportunities only become truly valuable if you have the right tools in place to find insights from your data sets (i.e., analyzing them) and communicate those findings with stakeholders who can act on them (i.e., communicating them).
Top 5 Data Analytics Tools
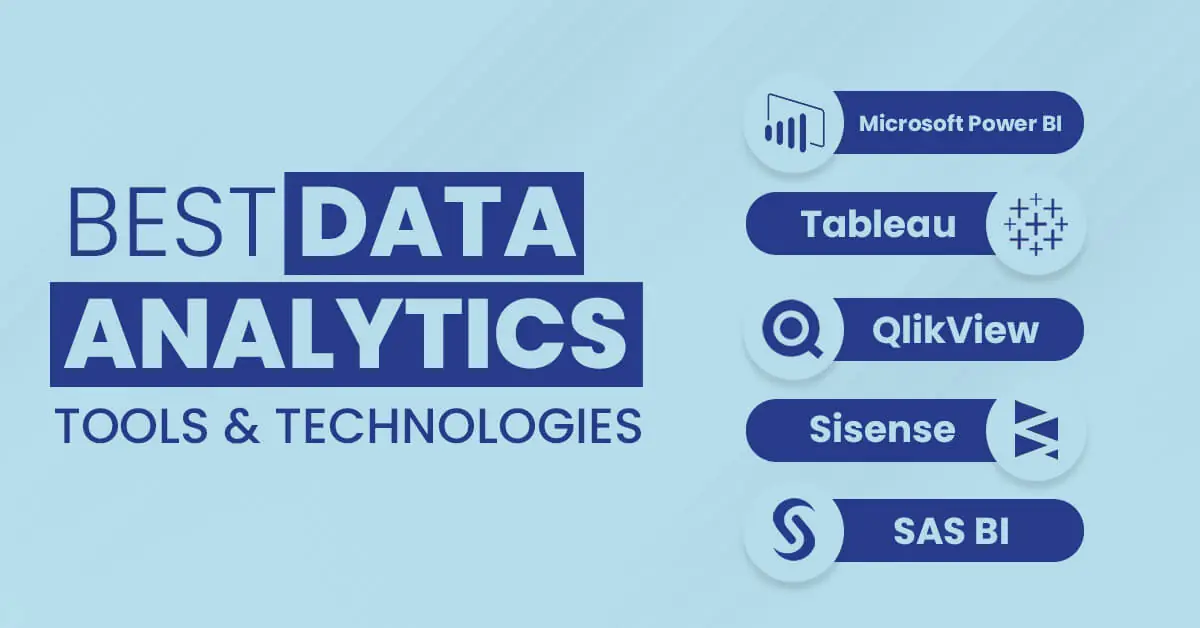
1. Microsoft Power BI
Power BI is an easy-to-use tool that allows you to visualize your data in whatever way works best for you. It also offers other useful features such as dashboards and reports. Features of Microsoft Power BI include,
- Power Query: This feature allows you to connect all your data sources into one place. So that they can be used in Power BI. This feature also helps you to create reports based on the data from different sources, as well as combine tables and columns from different sources into one table or column.
- Data Visualization: This feature allows you to create graphs, charts, and other visual representations of data that can help you understand trends in your business. You can also use this feature to share your results with others by creating reports and dashboards that are easy for them to understand.
- Data Analysis: This feature allows users to perform statistical analyses on their data so they can draw conclusions about how their company is performing over time (for example, by looking at sales figures).
2. Tableau
This tool is great for creating interactive data visualizations. It also allows you to pull from multiple data sources and combine them into one dashboard. Key features of Tableau include,
- Connect to any data source: Connecting to data is the first thing you need to do in order to start working with Tableau. In this regard, there are two options: one is connecting directly to a database and another one is connecting through an ODBC driver (which allows connecting Tableau with any database).
- Ease of use: Its easy-to-use interface makes it possible for even those who don’t have any experience in data analysis or business intelligence to create reports and dashboards. The interface consists of 3 components: a sidebar on the left side where users can select fields they want to work with; a view area where users can explore their data; and a canvas where users can create visualizations based on selected fields (e.g., bar chart).
- Built-in analytics: You don’t need additional tools like R or Python if you want to perform some basic analytics.
3. QlikView
QlikView is another business intelligence software that allows users to create visualizations and reports from their data sources. It also has a free version with limited features and an enterprise version that comes with these additional features.
- Data exploration: Explore data using charts, tables, and maps.
- Easy to use: Quickly build apps that are easy to use and maintain.
- Cloud ready: Run on-premises or in the cloud with no code changes required.
4. Sisense
Sisense is another business intelligence software that allows users to create visualizations and reports from their data sources. This option includes both free and paid versions of the software in addition, it offers subscriptions for those who want more access than just one license allows for this type of tool! Key features of Sisense are,
- Collaboration – Sisense uses a cloud-based system that allows you to share your data with other people in your organization, including non-technical users.
- Ease of use – Sisense is easy to use so anyone can benefit from its capabilities.
- Open source – Sisense is an open source tool, which means it’s free to use, and there are no restrictions on how you can use it.
5. SAS BI
SAS BI is another business intelligence tool that allows users to visualize data in their organization as well as share information with others via this platform’s interface (which can be accessed through any device). Key features of SAS BI include,
- Advanced analytics: Their capabilities are such as predictive modeling, forecasting, and advanced statistical analysis
- Robust data integration capabilities
- Easy access: It allows easy access to operational data through a variety of dashboards and reports
Top Use Cases for Business Data Analytics
Data analytics is an integral part of a company’s operations. It helps improve the efficiency of business operations, maximize profitability and achieve a competitive advantage over competitors.
Data and analytics help make better decisions; in different businesses like marketing, finance, healthcare, and retail for making strategic decisions. Let’s run through some important use cases for data analytics.
- In healthcare, data and analytics include everything from identifying patients who may need special care or treatment to predicting if certain kinds of illnesses are likely to occur during flu season based on past years’ historical data trends (and then alerting doctors so they can take action ahead of time).
- Another example is marketing campaigns. If you’re running an email campaign, you want to know how many people open your emails and how many click through on links inside them. Data analytics tools can tell you this information and more not just what the numbers are, but also what kind of content they respond to most favorably (and which ones they don’t).
- One of the use cases is fraud protection. This is a huge problem in the banking industry, where hackers are constantly trying to figure out new ways to steal money from people’s accounts. Data analytics solutions can help by looking at patterns and anomalies in customers’ credit card purchases, as well as other data points like IP addresses and geolocation data. If something looks suspicious, it can automatically flag that transaction for further review by a human employee.
Steps Involved in Data Analytics
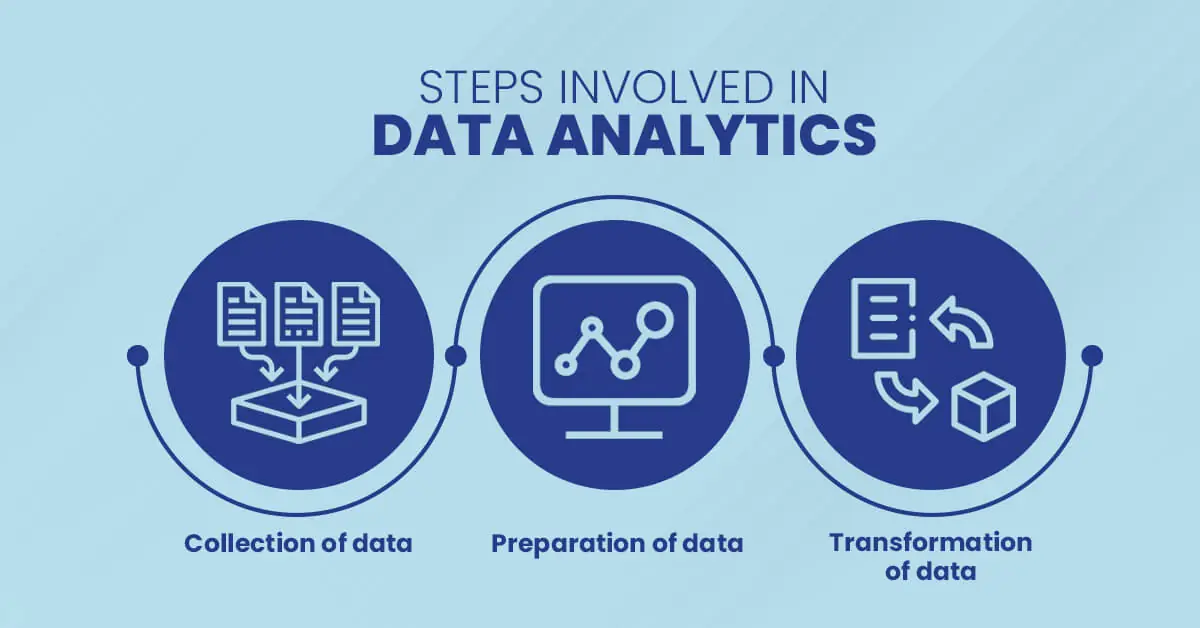
The data analytics process is all about involving the collection, preparation, analysis, and reporting of data. Data analytics involves the use of various tools and techniques to prepare data in a way that makes it easier to analyze. The steps involved in data analytics include,
1. Collection of Data
Data collection is for using various methods, such as surveys, interviews, and focus groups. The collected data should be accurate and relevant to the purpose of the study.
2. Preparation of Data
Data preparation involves cleaning up the raw data received from the collection by removing any unnecessary information, formatting it into a standardized format, removing duplicates if any exist, and deleting erroneous or inaccurate entries from the dataset.
3. Transformation of Data
Data transformation makes sure all values within each category are correct and represented equally. It helps compare different variables. Moreover, it helps identify trends within groups or across time periods more easily.
What Does a Data Analyst Do?
Data analysts are responsible for analyzing large amounts of data and presenting it in a way that is easy for others to understand. This can include anything from developing statistical models to determine which products will be most profitable, or using data from weather stations to warn people about impending storms.
They use statistical analysis, programming languages like Python and R, as well as machine learning algorithms in order to make sense of the large amounts of information they have available. A data analyst might be working on their own or as part of a team. They may work with other analysts who specialize in different areas so that together they can develop detailed reports for clients or senior management within their organization.

Conclusion
Data Analytics is one of the most sought-after skills in the modern workplace. As organizations continue to flood their enterprises with data, business leaders need help in making sense of it all. The above-mentioned points are the most crucial part of data and analytics that you should know before starting a project in data analytics.
If there are any other queries regarding data analytics, then feel free to ask in the comments below. Also, do check out our blog for more posts related to various fields like travel, programming, technology, and many more.
Top FAQs for Data Analytics
Data analytics is an ocean, with many different tools and processes that can be used to extract useful insights from data.
It is a tool that can help you analyze your business’s data to discover new insights. It’s like looking at your business’s data through the lens of a microscope, so you can see the details you might have missed before.
Data analytics is a general term used to describe a variety of techniques used to analyze data. Data science, on the other hand, is a field of study that focuses on how to best use these techniques to solve problems.
The types of data analytics include descriptive analytics, predictive analytics, and prescriptive analytics. Descriptive analytics describes what has already happened; predictive analytics predicts what will happen, and prescriptive analytics recommends what should happen.
Descriptive and predictive data analytics are two different types of data analytics. Descriptive analytics is used to describe what happened in the past; predictive is used to predict what will happen in the future.
In exploratory data analysis, you try out different ways of organizing your data and then decide which way works best for solving your problem. In confirmatory data analysis, on the other hand, you start with an idea about how things work and then test it against real-world evidence (i.e., your database).
Almost every business in some way uses data and analytics, but there are a few common users of this practice. These include marketing departments, e-commerce companies, financial institutions, and even sports teams.
If you’re new to data analytics, you’ll want to start by learning more about what it is and how it works. We can assist you with the basic understanding. Once you have a basic idea of how it works, you’ll want to take a look at some tools for collecting and organizing data so that you can begin using these techniques yourself.
Well, when you have a business and you want to grow it. You need to know your audience, how they interact with your brand and products/services, and how they find out about you in order to be able to grow your business. Without this information, you’ll be flying blind.
We can help by providing custom data analytics solutions that will allow you to analyze your own data and make informed decisions based on those insights. Here are three areas where we can help deploy an analytics strategy.
1. You want to learn more about your customers, their behavior, journey, and interests.
2. You want to make sure your business is on track for growth.
3. You want to determine what’s working and what isn’t working for your business.
There are many data analytics solutions benefits in your business. Some of the most important ones are.
1. It helps you understand your customers better
2. It helps you improve the quality of your products or services by understanding what your customers want or don’t want.
3. It helps you make more informed decisions about how much money to spend on marketing, advertising, and other things related to generating leads and sales for your company.
4. It allows you to make predictions about what will happen next so that you can plan accordingly (such as predicting when there might be more demand for certain items).
The cost to hire an analyst will vary depending on their skill level and experience with different kinds of projects. Generally speaking, it will cost anywhere from $40-100 per hour depending on the location and credentials of your candidate.
If you’re wondering what a typical data analytics project looks like, it’s a lot like a typical business project. It involves gathering requirements, defining scope, writing a plan, and then executing that plan.
There are some specific things that you’ll need to do in the data analytics realm, though. For example, you’ll need to ensure that your certified data analysts are well-versed in the different types of data science tools available and how to use them. You’ll also need to ask yourself whether or not your company has access to enough data for the project at hand.
If you’re managing a data analytics project with various moving parts, it’s important to know how much time each step will take as well as how much money it will cost overall. This way you can get an accurate picture of where your budget stands at any given time during the course of the project.
Data Analytics services providers are helpful because they allow businesses to make decisions based on facts rather than assumptions or hunches. Businesses no longer have to rely on guesswork when deciding how much inventory they need or what marketing campaigns will work best for them; instead, they can use real-time information provided by analytics firms to determine which strategies will be most effective for their businesses.


