DevOps
Cloud & On-Premises Monitoring: Set Up Prometheus, Grafana & Loki for Servers & RDS
1. Introduction
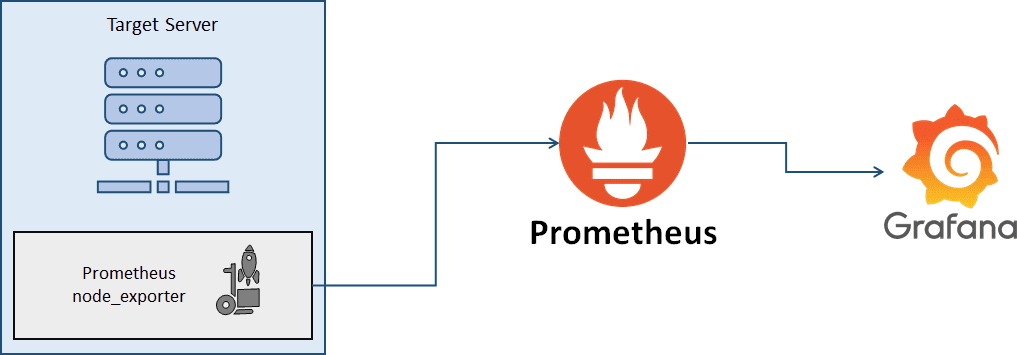
Prometheus, Grafana, and Loki are popular open source tools used for monitoring and logging in cloud and on premise environments.
- Prometheus: A powerful monitoring system that collects and stores metrics as time series data, helping in performance analysis and system health monitoring.
- Grafana: A visualization tool that provides dashboards and graphs to analyze metrics, allowing users to gain insights from monitoring data.
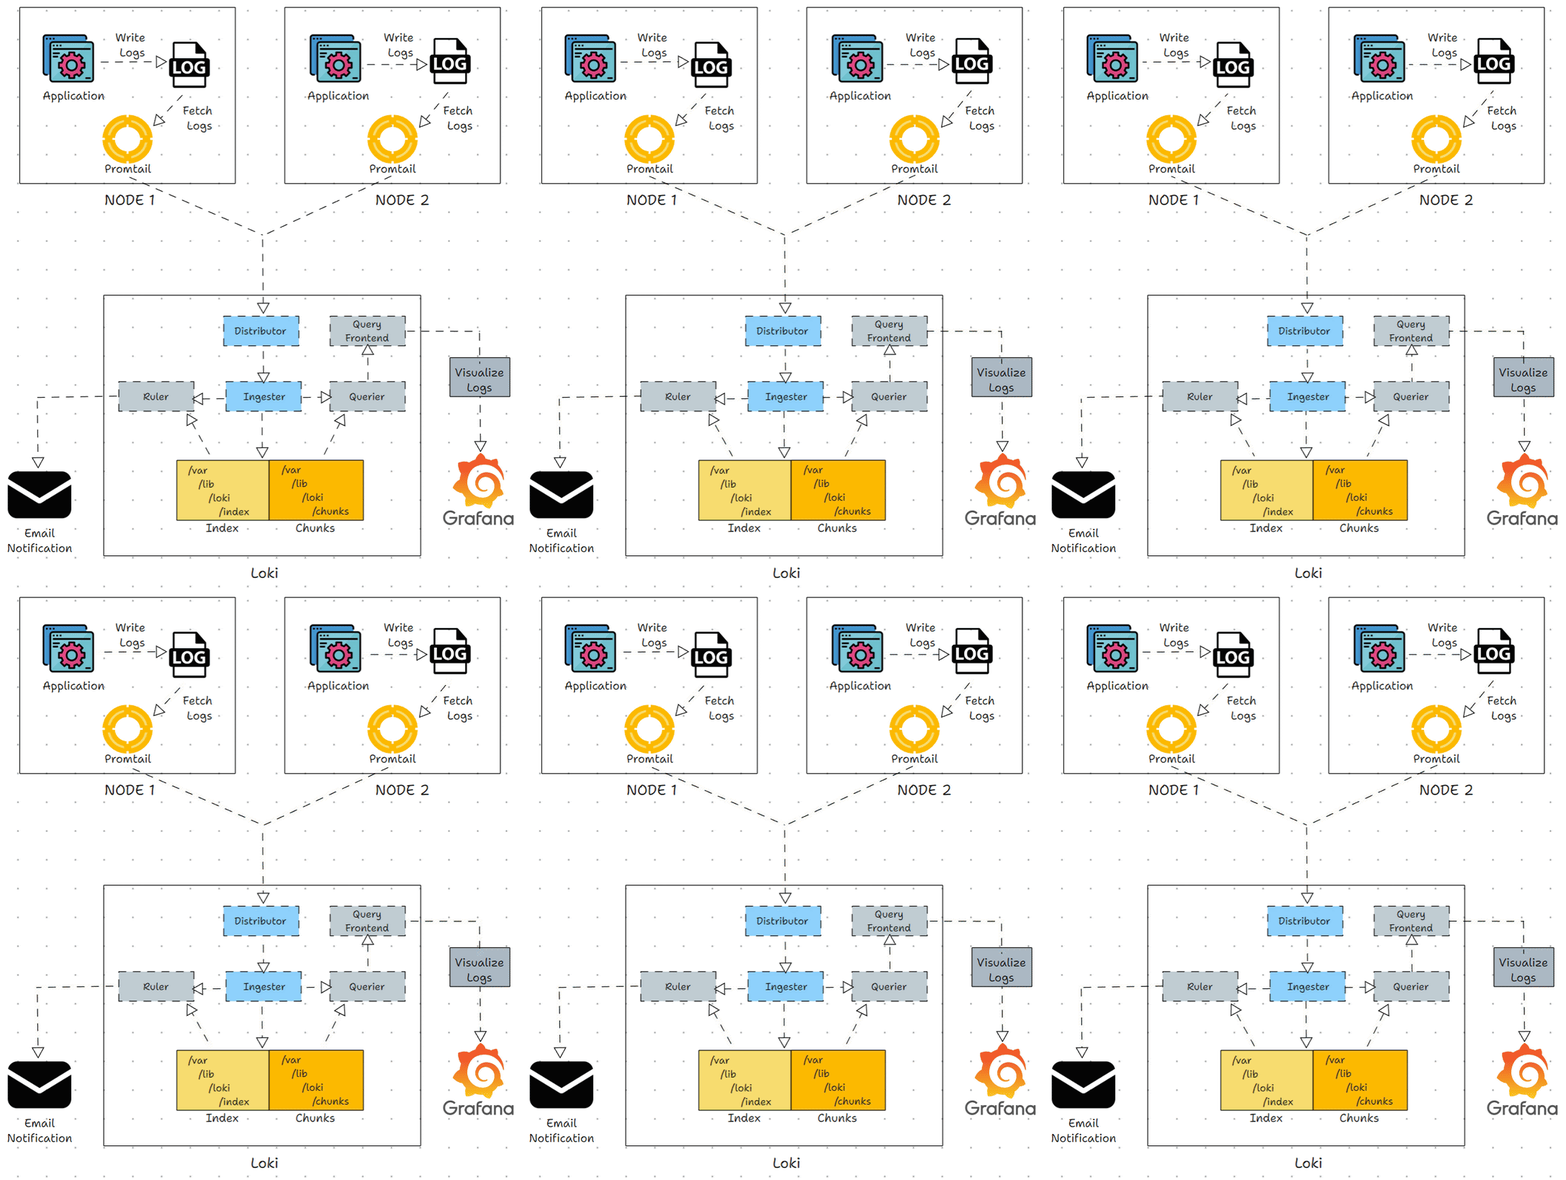
- Loki: A log aggregation system that efficiently collects and indexes logs, making log search and monitoring seamless when combined with Grafana.
- This guide will walk you through the setup process for these tools, including monitoring server metrics, RDS performance and logs.
.gif&w=3840&q=75)
2. Installation
2.1 Installing Prometheus
Download and Install Prometheus: wget https://github.com/prometheus/prometheus/releases/latest/download/prometheus-linux-amd64.tar.gz
tar -xvf prometheus-linux-amd64.tar.gz
cd prometheus-linux-amd64
Configure Prometheus:
Create a configuration file prometheus.yml:
global:

  scrape_interval: 15s

scrape_configs:

  - job_name: 'prometheus'

    static_configs:

      - targets: ['localhost:9090']
Start Prometheus: ./prometheus --config.file=prometheus.yml
Verify Prometheus:
Visit http://localhost:9090 in a browser to check if Prometheus is running.
2.2 Installing Grafana Download and Install Grafana:
sudo apt-get install -y software-properties-common

sudo add-apt-repository "deb https://packages.grafana.com/oss/deb stable main"

sudo apt-get update

sudo apt-get install -y grafana
Start Grafana:
sudo systemctl start grafana-server

sudo systemctl enable grafana-server
Access Grafana:
Visit http://localhost:3000 in a browser and log in with default credentials:
- Username: admin
- Password: admin
2.3 Installing Loki Download and Install Loki:
wget https://github.com/grafana/loki/releases/latest/download/loki-linux-amd64.zip

unzip loki-linux-amd64.zip

chmod +x loki-linux-amd64
Start Loki: ./loki-linux-amd64 -config.file=loki-config.yml
3. Server Monitoring Setup
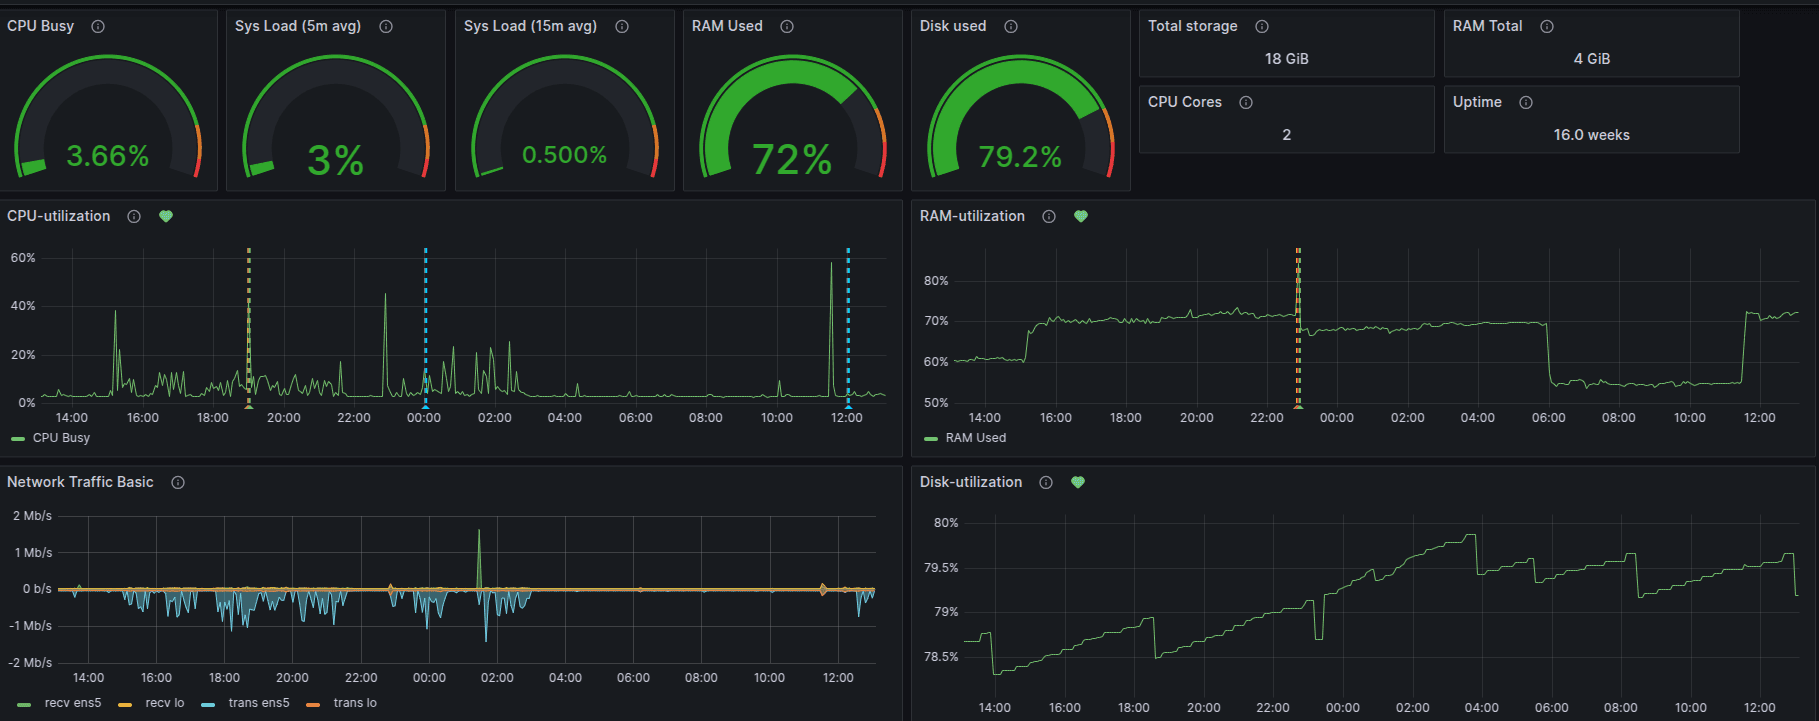
3.1 Setup Grafana Panels for Server CPU, RAM and Disk Monitoring
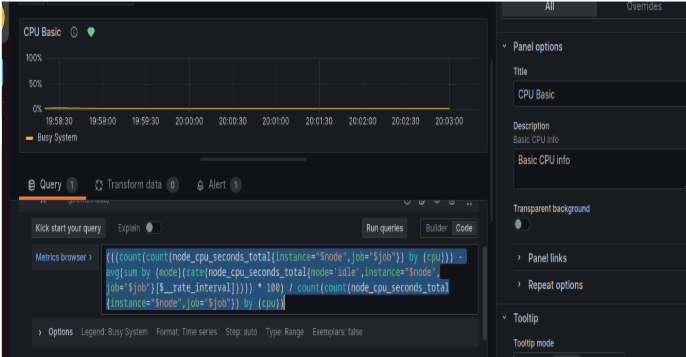
CPU Utilization Panel
- Navigate to the Dashboard.
- Click on Add+ > Visualization.
- Provide a title: CPU Utilization.
- Set up Prometheus queries to collect CPU data:
(((count(count(node_cpu_seconds_total{instance="$node",job="$job"}) by (cpu))) - avg(sum by (mode)(rate(node_cpu_seconds_total{mode='idle',instance="$node",job="$job"}[$__rate_interval])))) * 100) / count(count(node_cpu_seconds_total{instance="$node",job="$job"}) by (cpu)))
- Click Run queries, choose Gauge, and apply settings.
RAM Utilization Panel
Follow the same steps as CPU Utilization but use the following PromQL query:
100 - ((node_memory_MemAvailable_bytes{instance="$node",job="$job"} * 100) / node_memory_MemTotal_bytes{instance="$node",job="$job"})
Disk Utilization Panel
Use the following PromQL query:
100 - ((node_filesystem_avail_bytes{instance="$node",job="$job",mountpoint="/",fstype!="rootfs"} * 100) / node_filesystem_size_bytes{instance="$node",job="$job",mountpoint="/",fstype!="rootfs"})
4. RDS Monitoring Setup
4.1 Setup Grafana Panels for RDS CPU, RAM and Disk Monitoring CPU Utilization Panel
- Click on Data sources > Add new data source.
- Search for CloudWatch and configure it with AWS credentials.
- In the dashboard, click on Add+ > Visualization.
- Provide a title: CPU Utilization.
- Set data source as CloudWatch and configure the following: Namespace: AWS/RDS Metric Name: CPUUtilization Statistics: Average
- Click Run Queries, choose Gauge, and apply settings.

RAM Utilization Panel
Use the metric FreeableMemory and apply the following expressions:
($A)/(2*1000000000) ($A*100)/(2*1000000000) 100 - $C
Disk Utilization Panel

Use the metric FreeStorageSpace with expressions:
($A * 100) / (200 * 1.07 * 1000000000) 100 - $B

5. Logs Monitoring Setup
5.1 Install and Configure Promtail sudo apt-get update
sudo apt-get install -y unzip curl wget
5.2 Configure Promtail
Create a promtail-config.yml file with the following configuration:
server:

  http_listen_port: 9080

positions:

  filename: /tmp/positions.yaml

clients:

  - url: http://localhost:3100/loki/api/v1/push

scrape_configs:

  - job_name: system-logs

    static_configs:

      - targets:

          - localhost

        labels:

          job: varlogs

          __path__: /var/log/*log
5.3 Setup Grafana Dashboard for Logs Monitoring
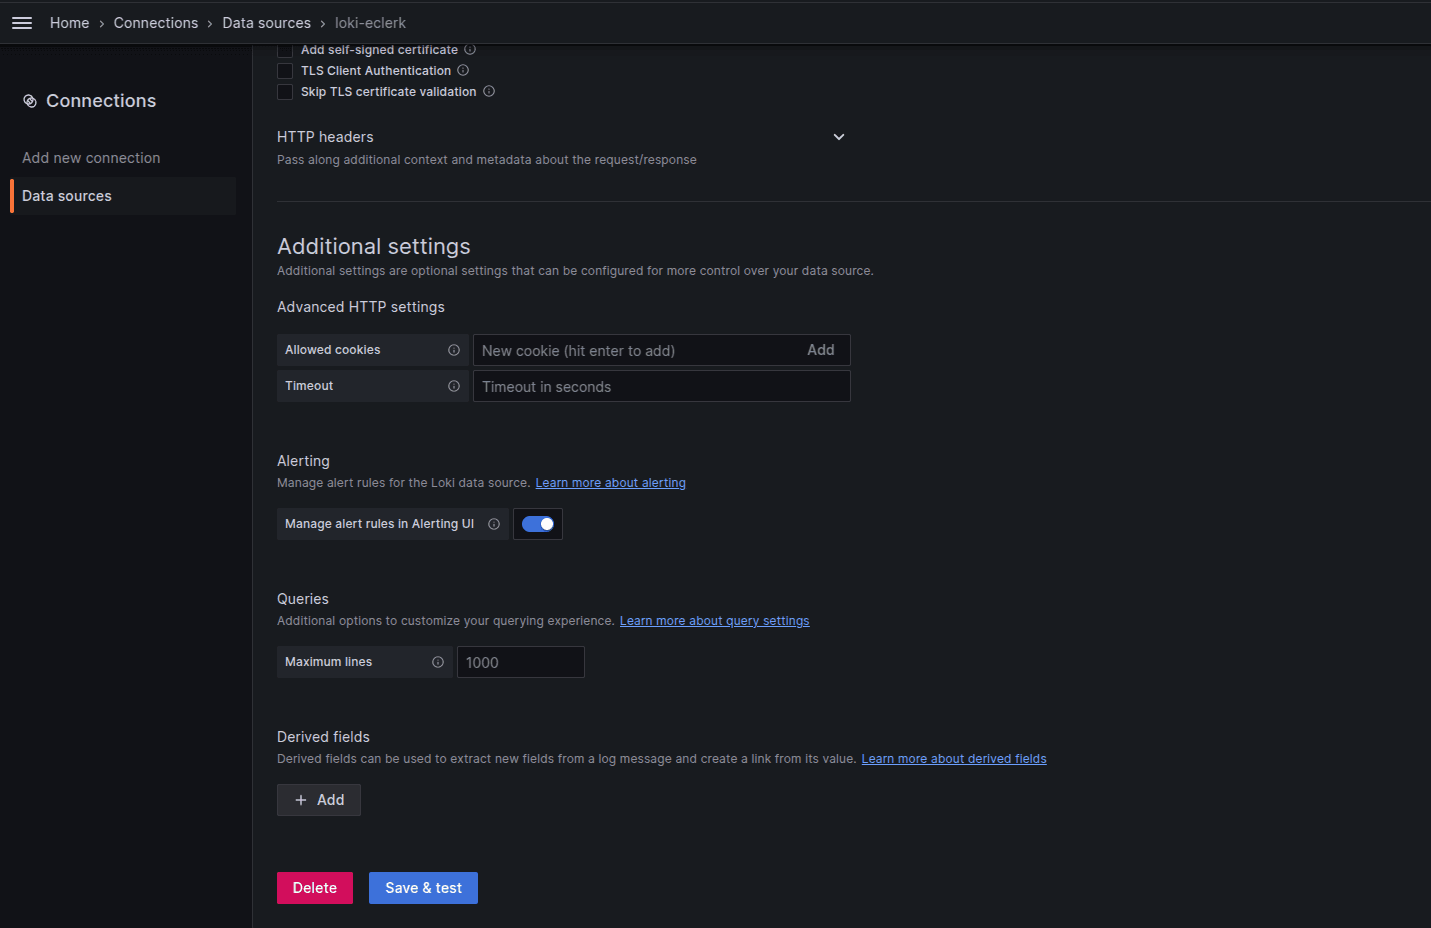
Add Loki as a Data Source in Grafana
- Go to Data Sources > Add new data source.
- Search for Loki.
- Set the connection URL: http://server-ip:3100.
- Click Save & Test.
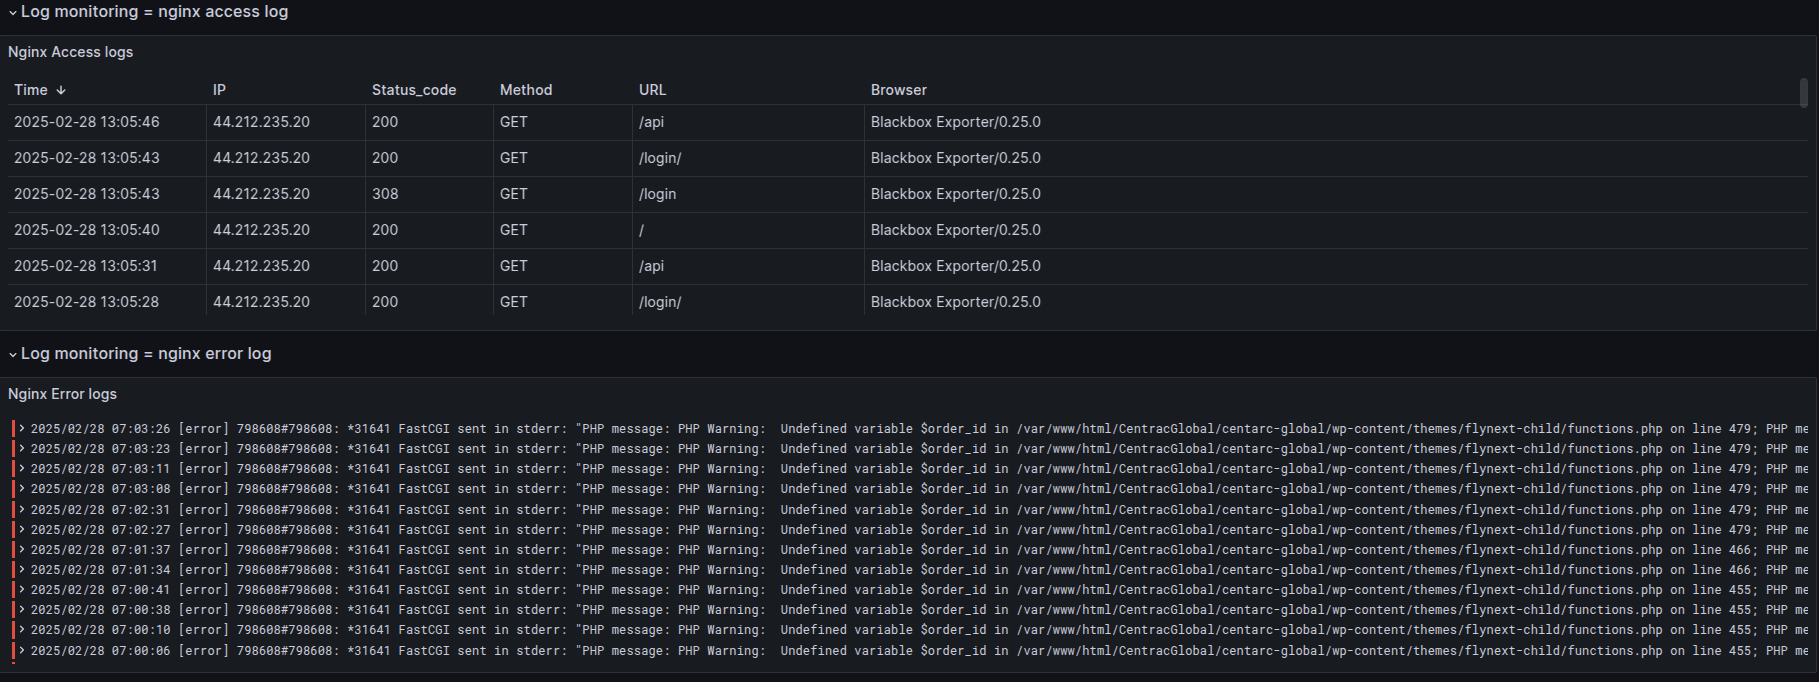
Create Nginx Access Log Panel
Use the following Loki query:
{job="nginx", filename="/var/log/nginx/access.log"} | line_format "IP={{ .ip }} Status_code={{ .status }} Method={{ .method }} URL=\"{{ .path }}\" Browser=\"{{ .browser }}\""
6. Alerts Setup for Server and RDS Monitoring
6.1 Server Monitoring Alerts(For CPU,RAM and Disk)Click Save rule and exit.
- Click Alerts > New alert rule.
- Set Threshold: 80%.
- Click Save rule and exit.

6.2 RDS Monitoring Alerts (For CPU,RAM and Disk)
- Click More > New alert rule in Utilization panel.
- Set Threshold: 80%.
- Click Save rule and exit.
7. Contact Point and Notification Policy (Email Integration)
Creating Contact Points
- Go to Contact Points > Add Contact Points.
- Enter a name.
- Select Integration: Email.
- Add recipient emails.
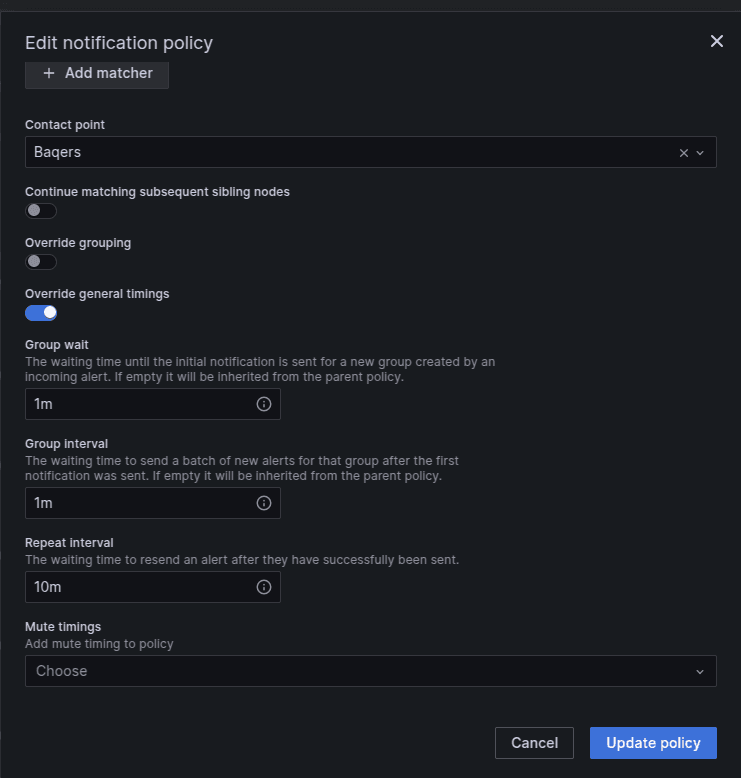
Creating Notification Policy
- Go to Notification Policy > New Nested Policy.
- Set Label name.
- Assign Contact Point.
- Click Save Policy.
Ready to transform your business with our technology solutions? Contact Us today to Leverage Our DevOps Expertise.

Contact Us