iOS
Optimizing App Performance: Using Instruments for Memory and CPU Efficiency
To provide a superior holistic user experience, the actual performance of the application itself has to be optimized. Xcode, the toolset of Apple has instruments that are necessary for effective profiling to identify memory leaks, CPU bottlenecks and many other performance issues in applications. This document will illustrate using instruments and also has step by step visual references for your guidance.
What are Instruments?
Instruments is a tool for analyzing and debugging purposes to determine memory leaks, memory excessive usage, CPU bottlenecks and similar other issues during the development process.
Detect high CPU usage and identify expensive operations
Investigate launch times and app responsiveness
Track network and disk activity
Why Optimize Performance?
1. Better User Experience: Fewer app crashes and lags.
2. Battery life: Uses less energy.
3. App Store Approval: Apple performance standards must be achieved to approve apps for the store.
4. Scalability: Your app scales to complex workflows easily.
How to Work with Instruments for Optimization
Step 1: Instruments Setup
1. Open Xcode.
2. Build and run your app in a simulator or on a device.
3. Navigate to Product > Profile or use the shortcut Command + I.
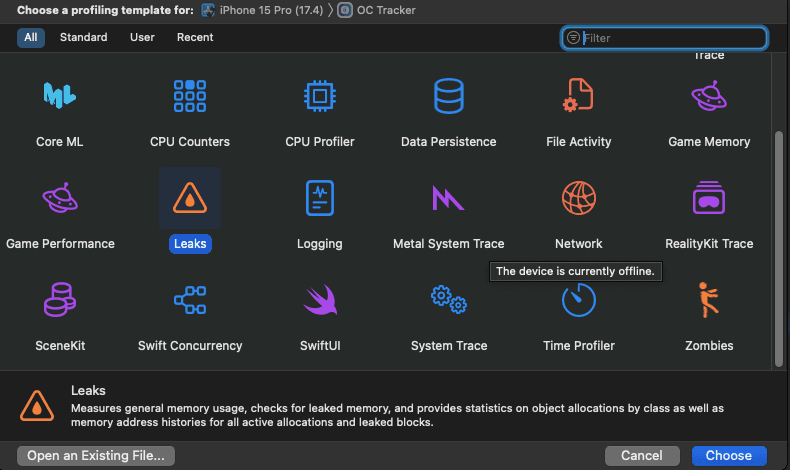
4. Choose an appropriate profiling template, such as Time Profiler, Allocations or Leaks.

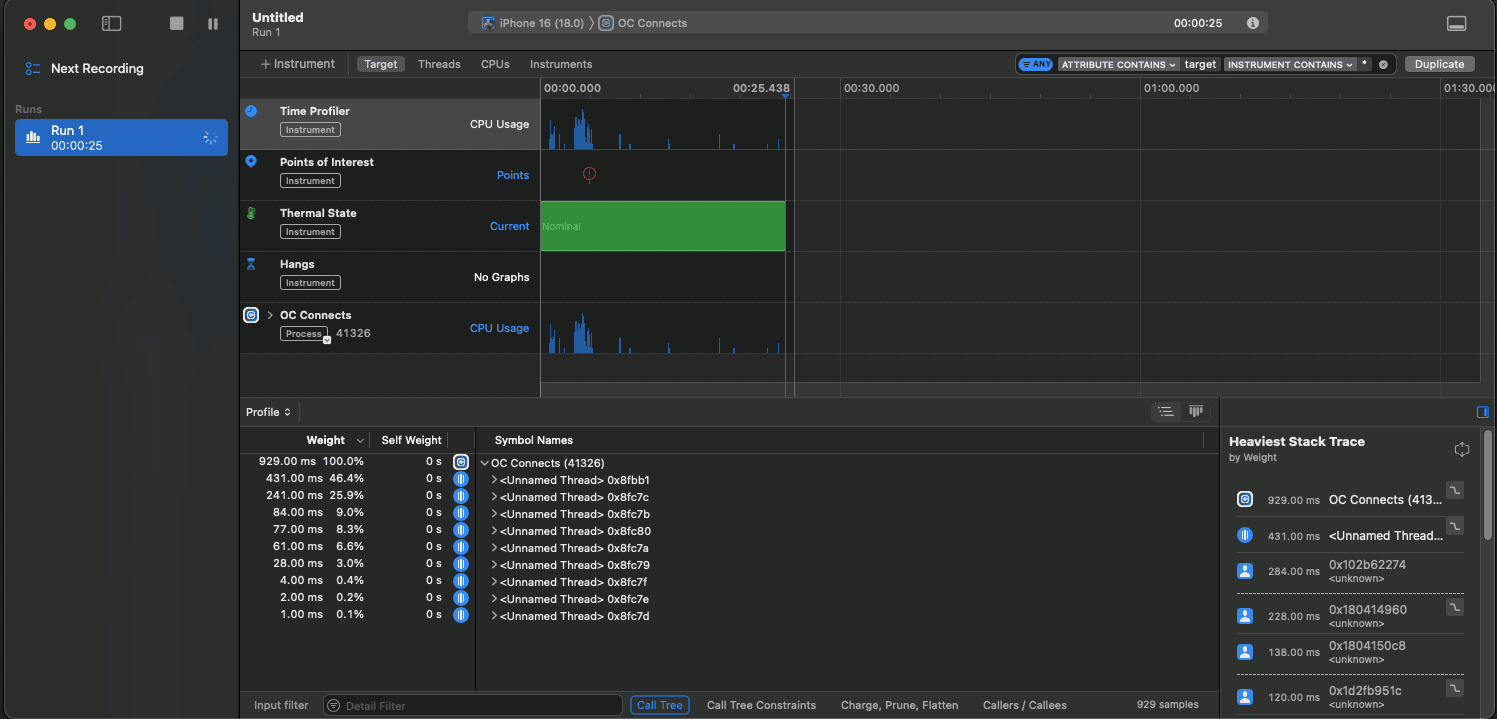
Step 2: CPU Activity Profiling Using Time Profiler
1. Choose the Time Profiler template.
2. Record using the red button
3. Test actions within your application by emulating usage patterns.
4. Look through the call tree for functions consuming the majority of the CPU
Include an image here: Interface for Time Profiler, Call tree marked where most of the CPU was spent
Note
Functions which are spending much time to complete.
Pay particular attention to these in order to decrease their cost in terms of computation.
Time Profiler interface

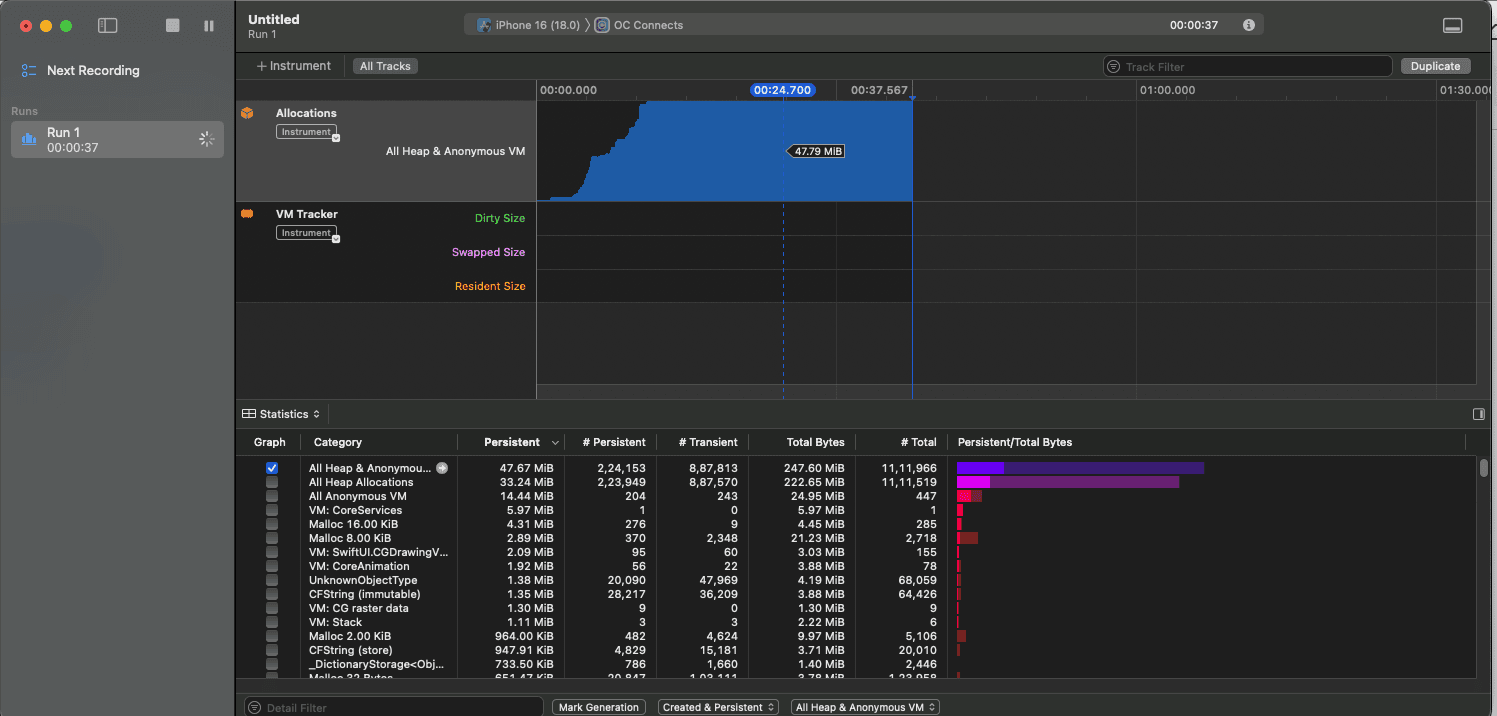
Step 3: Detect Memory Leaks with Allocations
Select the Allocations template.
Start recording and interact with your app.
Monitor memory usage graphs and retain cycles.
Switch to the "Leaks" tab to locate memory leaks.

Tips:
Use Instruments’ object history to trace where a leaked object was allocated.
Resolve leaks by ensuring proper deinitialization and avoiding strong reference cycles.
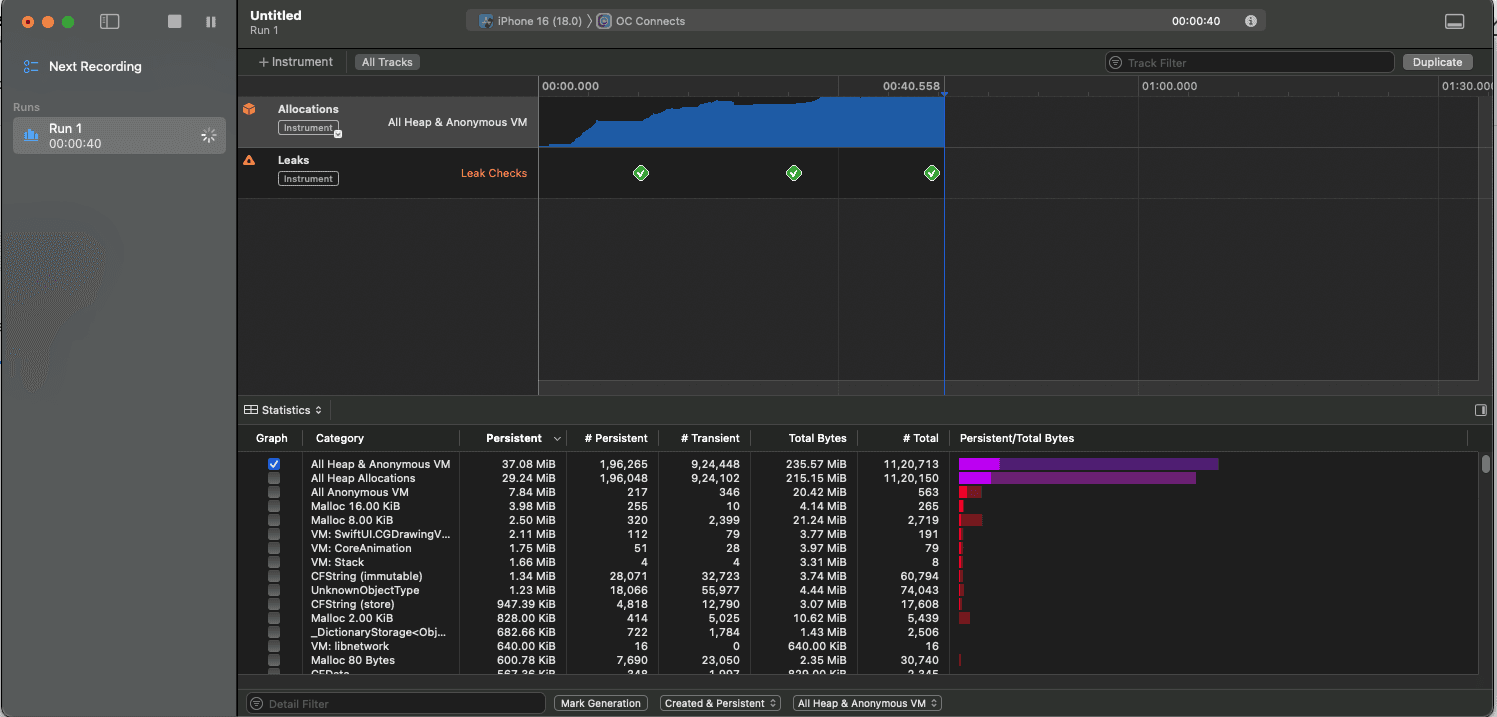
Step 4: Debug Memory with the Leaks Template
Open the Leaks template.
Perform actions in your app to trigger memory allocation.
Use the side panel to view leaked objects and investigate their origins.

Tips:
Leverage weak references to break strong reference cycles.
Review and test your app’s deinit implementations.
Step 5: Monitor Performance Metrics
1. Use Instruments and the Metrics tab to track the following metrics
• Disk I/O
• Network usage
• Energy impact
2. Identify where those abnormal spikes happen and modify them in their code sections.
Use the screenshot as a reminder, Metrics dashboard with high CPU, memory and disk usage highlighted.
Best Practices for Using Instruments
1. Frequent profiling: Incorporate performance testing in your routine developmental processes.
2. Realistic workload simulation: Test conditions that resemble the real usage conditions.
3. Optimization by iteration: Deal with one issue at a time and test post modification.
4. Device Testing: Test across devices to understand performance variations across hardware.
Important Findings
- Instruments provide detailed analysis on application performance.Profiling the application regularly will ensure stability and responsiveness.
- By using tools like Time Profiler, Allocations and Energy Log, developers will find it easy to identify and correct performance bottlenecks in their applications.
- Optimization is beyond fixing. It has to do with improving the user's experience with the app. Start using Instruments now to bring your app up to speed with the highest performance standard!
Ready to transform your business with our technology solutions? Contact Us today to Leverage Our iOS Expertise.

Contact Us