NodeJS
How to debug a NodeJs Application Efficiently
How to Debug a Node.js Application Efficiently
Debugging is an integral part of the development process, no matter what kind of application you are making with NodeJS. Bugs can appear in all shapes and sizes, from small syntax errors to large logical mistakes. Proper debugging ensures quicker identification and solution of these problems. In this blog post, we'll discuss a few techniques and tools you can utilize to debug your NodeJS application better.
1. Attach a Debugging Configuration
Begin by adding a debugger to VS Code. For this:
Open up your NodeJS project in VS Code and run it from the integrated terminal. This is important because you are going to attach a debugging process to your running project.
On the left side of the screen, you should click the bug icon (Debug and Run) in order to open the debug panel.
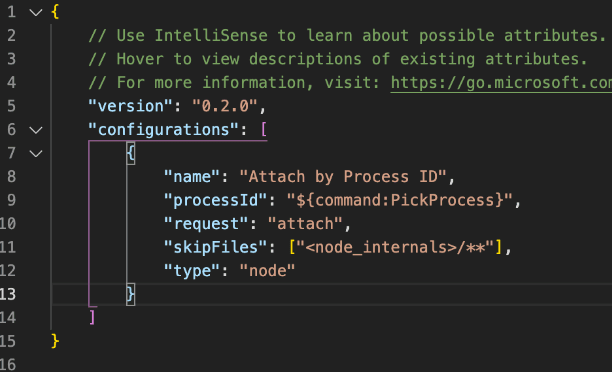
Create a file called “launch.json" VS Code will prompt you to select an environment for the launch configuration.
Select NodeJS as your environment.

When VS Code has completed creating the launch.json file, you can proceed to tailor the configuration to your needs.
Adding a "Attach to Process" Configuration
We use the "Node.js: Attach to Process" option. This will attach the debugger to a particular process on your machine, which makes backend services or even microservices easier to debug.
Here's how you add this configuration:
Under the debug configuration (launch.json), click Add Configuration.
Then, select NodeJS: Attach to Process from the list of options.
This will allow you to attach to a list of running NodeJS processes. This makes it easy to choose the process you are interested in debugging. In fact, you will find it very helpful where there are many services or instances running.

2. Run the Project in Debug Mode
Now that your configuration is complete, it's time to run the project in debug mode:
Click the green play icon at the top of the editor (bottom of the debug toolbar). This runs the debugger.
VS Code will present a view of the running processes of NodeJS. Select the appropriate process, it should be the top one if it's within the scope of your current project.
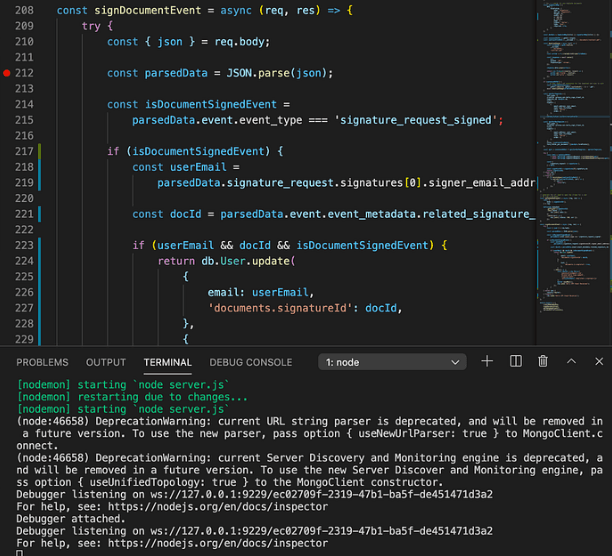
Once you select the process, you can set breakpoints in your code by simply clicking where in the line numbers you would like the execution to stop.
Running the project in debug mode lets you pause execution at breakpoints, inspect variables, and analyze the flow of your application without resorting to console.log statements.

3. Add Breakpoints and Explore
Breakpoints are a powerful feature that lets you pause your application at certain points and explore the state of variables and expressions. Here's how to use them:
When you add a breakpoint, you click on the line number of the location where you want execution to stop.
For instance, when debugging an endpoint, you may insert breakpoints into your controller function so that you can see what is arriving in the request parameters or database query results.
When code hits a breakpoint, you can hover over variables and see their values at runtime. This means you can pretty much get instant insights into how your application is working.
Use the navigation controls at the top of the screen to step through your code
Step Over (F10): Steps over to the next line in the same function.
Step Into (F11): Stepping into a function call lets you examine its execution.
Step Out (Shift + F11): Exits the current function and returns to the caller.
These controls let you track the flow of your application very precisely. They can help determine exactly where things are going awry.
A Practical Example
Let's say you're working on some API endpoint that hits the rate limit under the free tier of an external API. Instead of using console.log for debugging the response or requests (which might waste precious API calls), you can set up a breakpoint at the line where the external call is made.
By stepping through the code and viewing request parameters and responses, you can isolate and resolve any problems without using up other API requests. This way, you conserve such valuable resources as rate limits while exerting more control over the debugging process.
Advantages of Using the VS Code Debugger
Using breakpoints and the debugger from VS Code entails several benefits compared to the typical methods of applying logging:
Real-time variable inspection: To inspect variable values during debugging without polluting your code with console.log statements.
Precise control over execution: Step-by-step execution line by line, understand each one of the operations going on in that and where to track down the logical errors.
Less Noise in Code: You avoid adding and later removing console.log statements, which can get a little tedious and prone to errors. Instead, you have a cleaner and more efficient debugging experience.
Conclusion
VS Code comes with debugging features that make debugging Node.js applications actually a piece of cake. With "Attach to Process," breakpoints, and navigation controls, inspect and solve problems in your code with precision. The real-time insights you will derive from these tools will save you thousands of hours as opposed to debugging with console.log.
Breakpoints, step throughs of the code, and inspections of variables within the editor are all mandatory activities to understand how any Node.js application is behaving in real-time in an efficient and debugged manner. Not only do they improve your productivity but also make you understand the code in a better manner.
All these debugging techniques transform how you have been doing so far in terms of Node.js application troubleshooting, and finally, you can focus on feature creation rather than wasting too much time searching for bugs in code.
Ready to transform your business with our technology solutions? Contact Us today to Leverage Our NodeJS Expertise.
